Five Google Analytics tips you need to know close

There should be no need to introduce you to Google Analytics, the most widely used web analytics application. The tool is powerful and FREE so it isn't hard to see why it is so popular. However, only a small percentage of users fully harness it's potential.
Google is constantly refining and adding new features to it's analytics service. Although you need to be a bit exploratory if you are going to make the most out of the 85 Google Analytics reports available. Lurking beneath the main dashboard Google Analytics gives you the necessary tools to analyse all of your website's data. Here are 5 under-used Google Analytics features you need to know.
1. Exclude internal traffic
Internal traffic to your site can skew your Google Analytics report. If you want to get a better picture of the traffic coming to your site, it is advised to filter out your internal traffic. Google Analytics allows you to set up a filter to easily exclude your own visits from the analytics results.
-
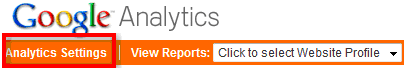
On your Google Analytics dashboard, click on the Analytics Settings link.
-
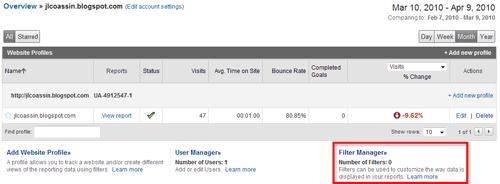
Then click on the Filter Manager link.
-
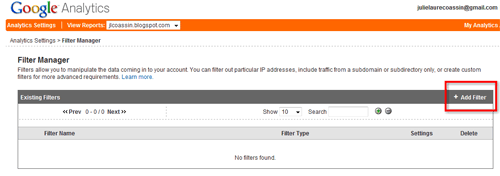
The Filter Manager page will show you all existing filters for your site. Create a new one by clicking on the Add Filter link.
-
In the new filter window:
Enter the name of your new filter (ie: internal traffic)
"Filter type" - tick the radio button "predefined filter"
We want to exclude traffic from your IP address, so you will need to select "Exclude," "traffic from the IP addresses," and "that are equal to" in the three dropdowns.
Enter your IP address (if you don't know your IP address, simply click on this link)
Select which websites you want to filter by clicking on the appropriate website profile(s) and then clicking "Add"
Finally, click "Save Changes"
Your Google Analytics report should now exclude your own traffic and you can get more accurate tracking data.
2. Set up goals and funnels tracking
(probably the most important tracking feature to set up)
Google describes a goal as a website page which a visitor reaches once they have made a purchase or completed another desired action, such as a registration or download. Please note that if you have an e-commerce site, there is a more specific tracking feature for measuring your goals.
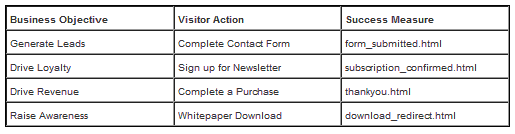
The "goals" feature is a simple way of tracking your business objectives for your website. A goal must be a measurable action performed by your website's visitors (such as a page view visit to a thank you page). So a business objective + a measurable action = goal
Check out these common examples:
Usually between the initial click and the visitor's action, visitors are required to make multiple steps to complete the desired action. This creates the "goal funnel", with each step being a measurable action. Your visitor can take two routes: 1) follow the intended path, which means the goal is "completed" or 2) decide to leave the process along the way in which case the conversion chain is broken and goal abandoned.
Google Analytics allows you to track visitors as they go through the different steps of the goal funnel and shows you how many potential customers abandon the process, and at which point. The funnels feature is an amazing and very valuable tool that will help you detect issues with your conversion process. With this precious information in hand, you should be able to address the sections of your site preventing you from completing your business objectives, informing future updates.
Setting up goals in Google Analytics is one of the most important actions when it comes to configuring your account. Here is how to do it:
-
First you will need to define your goal funnel – When you are on your website, ask yourself what are the steps required to complete the goal? Once you know, write down the URLs that will define your funnel (or ask your developer).
For example:
1. start_registration.html
2. enter_shipping_info.html
3. enter_subscriber_preferences.html
4. finalise_registration.html
5. thank_you.html
- On your dashboard, click on "Goals" on the left hand side navigation and click on "Set up goals and funnels"
-
Enter goal information.
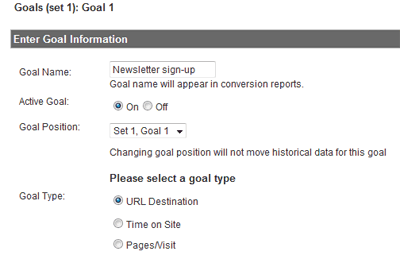
Note you have the choice between 3 different types of goal: URL destination, time on site and pages/visit. -
Enter goal details
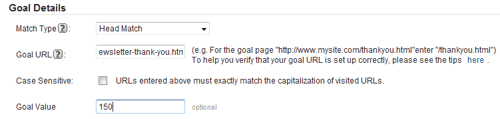
Set "Match Type" to either "Exact Match," "Head Match," or "Regular Expression Match. This mainly depends on the type of websites you have (ie: static vs. dynamic). You can read more about the difference between Head, Exact, and Regular Expression Match on Google Analytics help page.
Select if the goal URL is case sensitive and finally you can add a value to a goal. - Define Your Goal Funnel - Specify the URLs and name each steps of your funnel.
- You are done! You can now analyse your goals performance.
You will only be able to see your goals data in reports after a few days of activity but please note this feature is not backwards compatible. Once the data is collected, go to your dashboard, click on Goals and open the Funnel Visualization Report. Google Analytics will tell you the following:
- How many people enter at each step of the funnel.
- How many people abandon at each step.
- How many people make it to the next stage.
- How many people make it all the way through.
The funnel will look something similar to this:
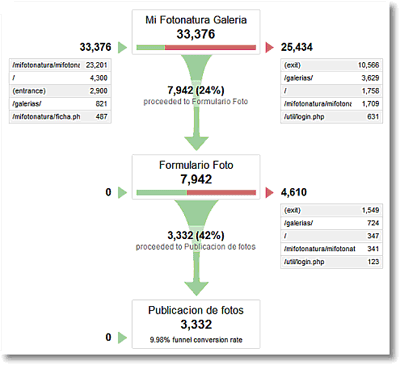
On the left you can see how your visitors enter the funnel, on the right where they leave the funnel and where they go. Finally the middle part shows you how visitors progress to the funnel, how many continue on to each step. In the example above, you can see 33,376 started the process and 25,434 go to another section but approximately 10,000 users leave the site at the first step. We can see something must be wrong with the first step. However, the abandonment on the second step is lower, which is good. Finally, you can see the overall conversion rate is 9.98%.
If you need a bit more information about goals in Google analytics, I suggest you check out this very handy tutorial: "Google Analytics IQ Lesson: Goals in Google Analytics"
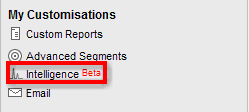
3. Set up Analytics Intelligence & custom alerts
Google analytics recently launched Intelligence Beta which is an "algorithmic driven intelligence engine". What does that mean? It means Analytics Intelligence constantly monitors your website's traffic, detects any anomaly in your traffic patterns and sends you automatic alerts of significant changes over daily, weekly and monthly periods. Clever eh?
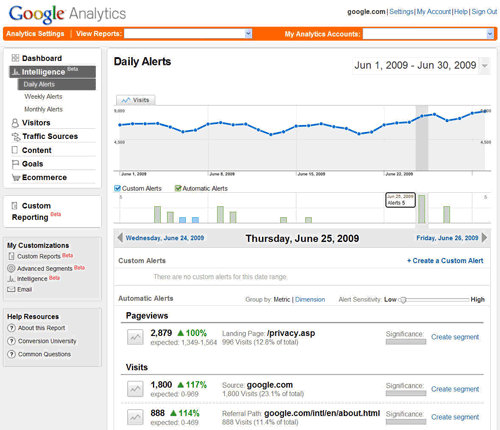
You can also create your own custom alerts, where you set the conditions for the alert depending on what you want to monitor. Go to the left hand side of your dashboard and click on "Intelligence Beta"
You have 2 choices:
-
Set up your own custom reports for specific things that you want to monitor.
For example, you could have just launched a campaign in a specific location and wanted to be notified how the campaign is impacting traffic from that location. You could also create another alert to see when the traffic from that location is decreasing, so you can find out when the campaign starts to run out. - If you are not very familiar with setting up "customised alerts" then you can select one of the templates on the "manage intelligence alerts" page. Just click on "copy" and modify the alerts so it monitors what you need.
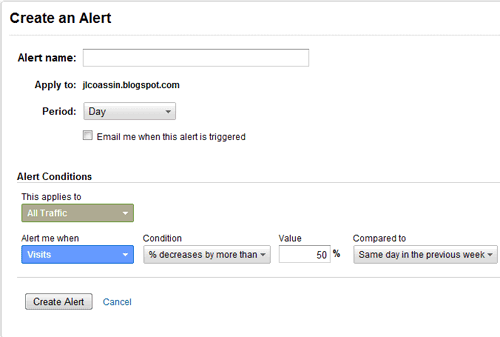
Once your intelligence alerts are setup and triggered you will receive a custom alert, posted in your Daily, Weekly or Monthly Alerts on your Google Analytics account or sent by email if you requested that option.
For further information on the Analytics Intelligence feature, visit the Google Analytics Help Center.
4. Tracking traffic from social media
With Google Analytics you can by default analyse traffic mediums such as direct, organic etc. It also automatically tracks referrals from other websites, including Facebook, Twitter, LinkedIn and other networking sites. However, in your Traffic Source reports, social network visits are grouped together with visits from all the other referral links to your site. If you are only interested in social network referrals there is a trick you can use.
-
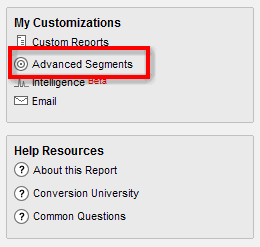
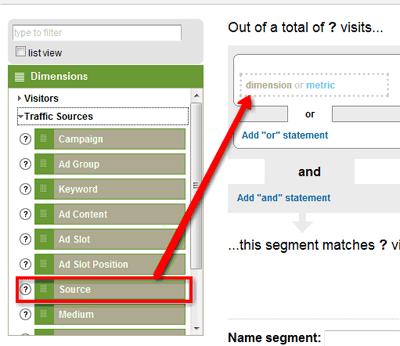
Select Advanced Segments from the lower left hand side bar in your Google Analytics Dashboard.
-
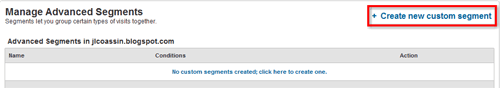
Once in the Advanced Segment page, select Create a new custom segment.
-
Drag the "source" box which is under "Traffic sources" to "dimension or metric" window.
-
Select "Matches Regular Expression" from the "Condition" drop down. In the Value field, paste the following sources:
digg|aim|friendfeed|econsultancy|blinklist|fark|furl|misterwongs|wikipedia|stumbleupon|netvibes|
bloglines|linkedin|facebook|del\.icio\.us|feedburner|twitter|technorati|faves\.com|newsgator|PRweb|
msplinks|myspace|bit\.ly|tr\.im|cli\.gs|zi\.ma|poprl|tinyurl
If you wish to add more domains, simply add a "|"symbol between each name. However this field is limited to 256 characters. -
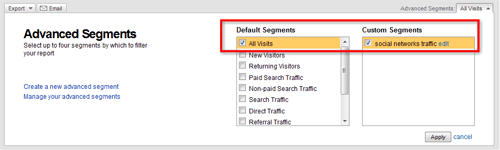
Name your segment (ie: "social network traffic"), click on "Create segment" and you are done! Then from your dashboard, click on "Advanced segments – All visits" and tick the box for the social networks traffic custom segment you have just created, finally apply the changes.
- Well done, you can now start comparing your social media traffic sources in relation to your overall site traffic.
5. Create annotations on reports
Google launched this very handy feature at the end of last year allowing comments on graphs regarding events that have happened. Users can either add shared or private notes on the dashboard graph. Every time you make a change to your site, be that technical, design, content or any other updates, make sure you add a note specifying what has been done so if the performance of the site improves/decreases, you can easily explain to your colleagues who see a spike or a dip the reasons why. Watch this video to see it in action.
The "annotations" feature is a great collaborative feature that brings intelligence to data and makes your stats understandable and shareable within your company. As Google explains "A simple note from a colleague can save hours of real work (and frustration) for an analyst who is tasked to explain a usually dry set of numbers."
If you want to go beyond the tips we have discussed here and learn more, here is a list of Google Analytics blogs:
- Google Analytics blog
- Occam's Razor by Avinash Kaushik
- Analytics Market
- Analytics talk
- LunaMetrics
I hope this post was useful and you will soon become a more knowledgeable Google Analytics user!